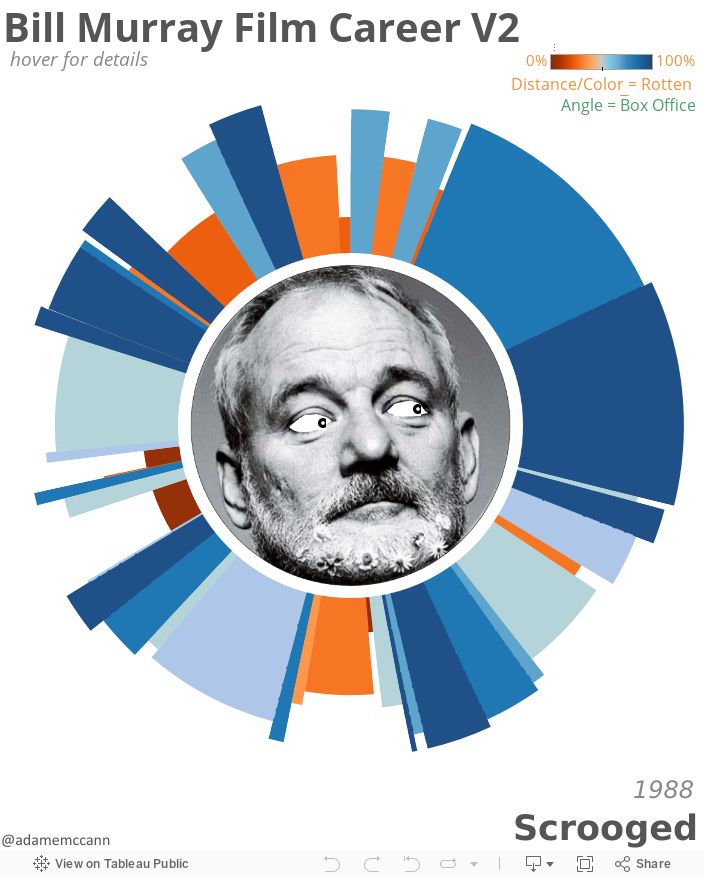

Sunburst / Ring Chart in Tableau
So after creating the stupid Bill Murray viz in my last post I thought... this could get stupider. And behold a sunburst or ring chart in Tableau. In addition to the creepy eyes and the donut chart, I added distance which represents Rotten Tomatoes score. This is essentially 9 pie charts of increasing size, stacked on top of one another with a conditional color to create the rings. If the film's score does not meet the ring's threshold it is colored white and therefore hidden. Enjoy.